Simplicity
Anticipating the needs of citizens and providing services before they are requested.

Creating a journey map allows teams to visualize the end-to-end experience
of a user.
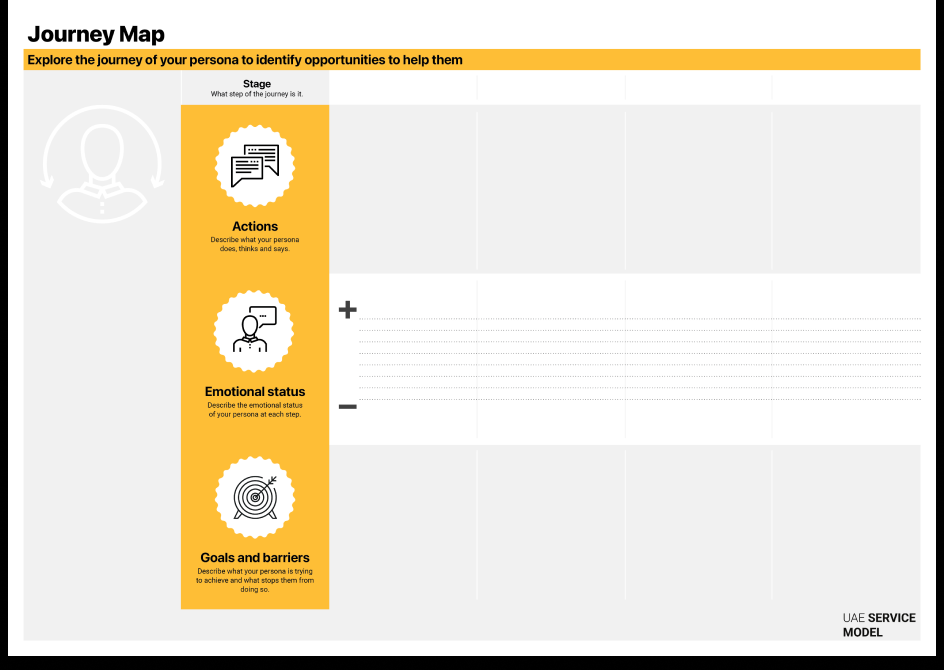
Creating a Journey Map allows teams to visualize the end-to-end experience of a user as they interact with a service, product, or system. It helps uncover what users do, think, and feel across each stage of their journey — revealing barriers, emotions, and opportunities for improvement. By mapping actions, touchpoints, and emotions, teams gain a shared understanding of the user experience across digital and physical channels, ensuring that design decisions are rooted in real-world behavior. The Journey Map connects user insights to operational processes, supporting organizations in creating seamless, integrated, and human-centered services. Use this tool to focus purely on the user's perspective and emotions (the 'why' and 'what'), before using the Service Blueprint to define the internal operations (the 'how') needed to support them.
2–3 hours (per persona or scenario)
Intermediate
Define & empathy
Persona card
Journey Map template (digital or printed), personas, research findings, sticky notes or digital tags, markers or annotation tools
Service designers, UX researchers, product owners, policy designers, frontline staff, and system representatives
Choose one of your key personas and identify a specific situation or service interaction to explore (e.g., applying for a license, accessing healthcare, or reporting an issue).
Break down the process into distinct phases — for example: Awareness, Application, Processing, Completion, and Follow-up. Each stage represents a critical step the user takes from start to finish.
For each stage, describe what the persona does, thinks, and says. Capture real quotes or behaviors from your research to make the journey authentic and relatable.
Plot the user’s anxiety or confidence levels. Identify “low points” where an empathetic human or “humanized” AI response is most needed.
Describe what the user is trying to achieve at each stage, and the obstacles preventing them from doing so. Consider operational, informational, or emotional barriers.
Mark all physical, digital, and human touchpoints involved in the journey. Highlight points of transition between channels or departments, as these often create friction. Handoffs. Clearly mark moments where the user switches from a digital channel to a human agent, Ensure this transition preserves data context.
Analyze the map to spot improvement opportunities — moments where interventions could simplify the process, reduce stress, or enhance satisfaction.
Emotional Simulation: Feed your Persona and Journey steps into an AI tool and ask: "Simulate the emotional highs and lows of [Persona Name] going through these steps. Where is the anxiety highest?"
Friction Predictor: Upload your draft journey steps to an AI and ask: "Identify potential friction points or logic gaps in this user flow that might cause a user to drop out."
Base your journey on real user data and quotes rather than assumptions.
Include stakeholders from design, operations, and policy to ensure accuracy and shared understanding.
Use icons, color, or curves to represent emotional highs and lows.
Include face-to-face and physical experiences that impact user perception.
Use personas to anchor the journey and link insights to the Opportunity Card or Service Blueprint for next steps.
Test your journey with users and frontline staff to confirm it reflects the real experience.
A public service team used the Journey Map to analyze the end-to-end experience of citizens applying for housing support.
By mapping user actions and emotions, they discovered that applicants experienced frustration during document verification — often needing to re-enter data already stored in other government systems. This insight led to a redesign of the process, integrating data-sharing between agencies and enabling automatic pre-filling of forms.
The result: reduced application time by 40%, fewer user drop-offs, and higher satisfaction among applicants and frontline staff.
Our service principles that relate to journey map.